JARB1 (Jarbidge Wilderness, NV, Lat. 41.8926, Long. -115.4261, Alt. 1882)
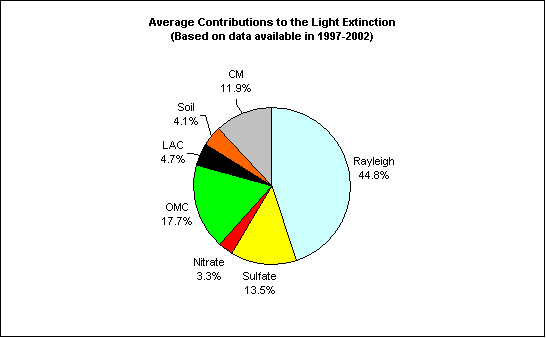
6 years aerosol data are available in Jarbidge Wilderness during the sampling period of 1997 - 2002. As shown in Figure 1, the overall average total light extinction coefficient (Bext) is 22.3 Mm-1 (Visual Range ~ 175 Km; Deciview ~ 8.0). The average PM2.5 mass concentration is 3.1 mg/m3. The average contributions of the major aerosol components to Jarbidge Wilderness haze are particulate sulfate 13.5%, nitrate 3.3%, organic matter (OMC) 17.7%, elemental carbon (light absorbing carbon, LAC) 4.7%, fine soil 4.1% and coarse mass (CM) 11.9%.
Figure 1 Average contributions of major aerosol chemical components to light extinction (Based on data available in 1997-2002)
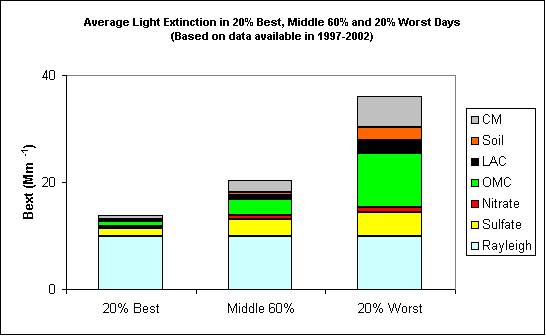
Figure 2 Average contributions of major aerosol chemical components to light extinction in 20% best, middle 60% and 20% worst days (Based on data available in 1997-2002)
As Figure 2 indicates, the average aerosol light extinction coefficient (Bext – Rayleigh Scattering (10 Mm-1)) during the 20% worst days is 26.1 Mm-1, which is about 7.0 times of the value of 3.8 Mm-1 during the 20% best days and 2.5 times of the value of 10.5 Mm-1 during the middle 60% days. OMC is the largest contributor to aerosol light extinction, with a contribution of 38% in the 20% worst days. CM also contributes ~22% in the worst days.
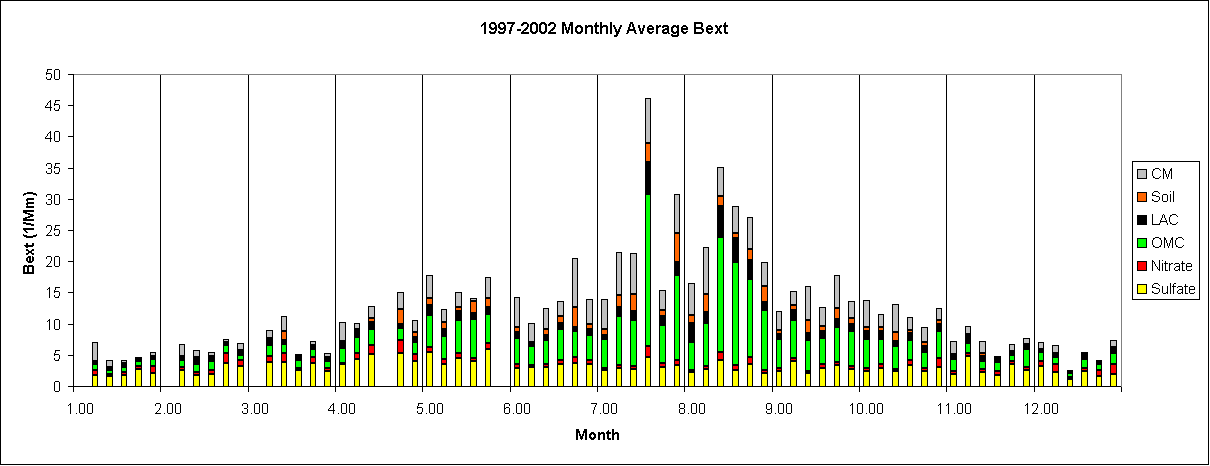
Figure 3 suggests that the highest occurrence of the 20% worst days happened in July and August during which more than 50% of the sampling days are the 20% haziest days at Jarbidge Wilderness. As shown in Figure 4, in July and August, OMC is the largest aerosol contributor to haze, with a contribution of ~ 32% and 35% during the 20% worst days. CM is the second biggest aerosol contributor to haze, with a contributions of ~ 18% and 15% in July and August, respectively. Sulfate, fine soil and CM are the main aerosol contributors to haze in March and April, and nitrate is the largest contributor in December, though the occurrence of the 20% worst days is low in these months. OMC is the largest aerosol contributor to haze from May to November except June when CM and OMC both contributes ~20% to haze in the worst days.
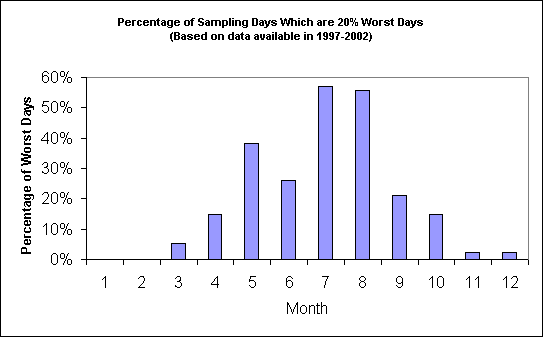
Figure 3 Percentage of sampling days that are 20% worst days in each month (Based on data available in 1997-2002)
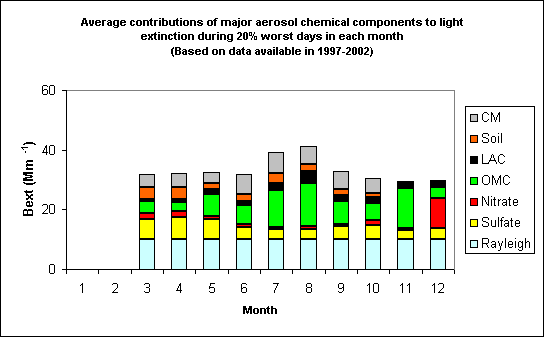
Figure 4 Average contributions of major aerosol chemical components to light extinction during 20% worst days in each month (Based on data available in 1997-2002)