DEVA1 (Death Valley Monument, CA, Lat. 36.5088, Long. -116.8469, Alt. 125) Print-Friendly Version Print-Friendly Version (B&W)
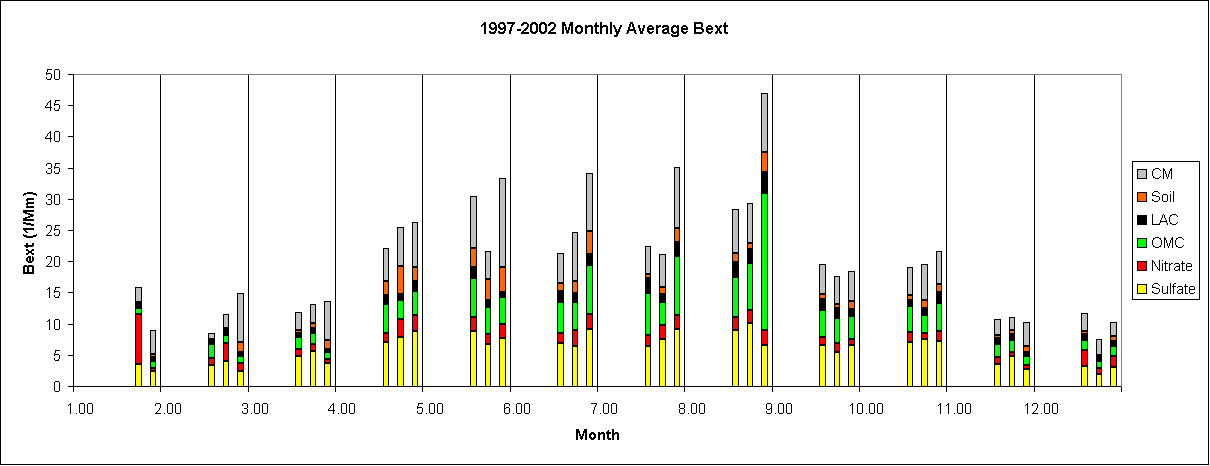
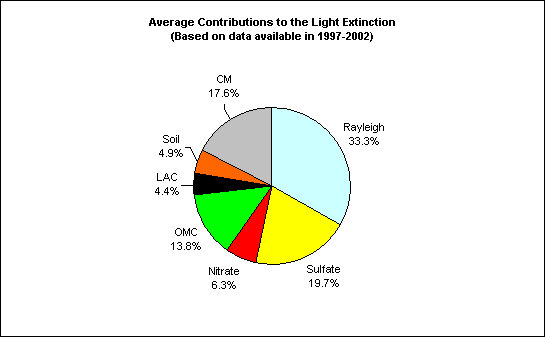
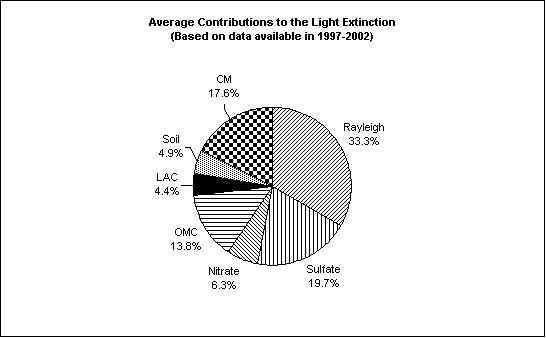
2 year and 10 month aerosol data are available in Death Valley Monument during the sampling period of 1997 - 2002. As shown in Figure 1, the overall average total light extinction coefficient (Bext) is 30.0 Mm-1 (Visual Range ~ 130 Km; Deciview ~ 11). The average PM2.5 mass concentration is 4.7 mg/m3. The average contributions of the major aerosol components to Death Valley Monument haze are particulate sulfate 19.7%, nitrate 6.3%, organic matter (OMC) 13.8%, elemental carbon (light absorbing carbon, LAC) 4.4%, fine soil 4.9% and coarse mass (CM) 17.6%.
Figure 1 Average contributions of major aerosol chemical components to light extinction (Based on data available in 1997-2002) (B&W)

Figure 2 Average contributions of major aerosol chemical components to light extinction in 20% best, middle 60% and 20% worst days (Based on data available in 1997-2002) (Data Table) (B&W)
As Figure 2 indicates, the average aerosol light extinction coefficient (Bext – Rayleigh Scattering (10 Mm-1)) during the 20% worst days is 39.8 Mm-1, which is about 6.4 times of the value of 6.2 Mm-1 during the 20% best days and 2.2 times of the value of 17.8 Mm-1 during the middle 60% days. CM, sulfate and nitrate are three of the largest contributors to aerosol light extinction during the 20% worst days, and the contribution of CM, sulfate and nitrate to aerosol light extinction are ~ 25.7%, 25.4% and 24.6% in worst days.
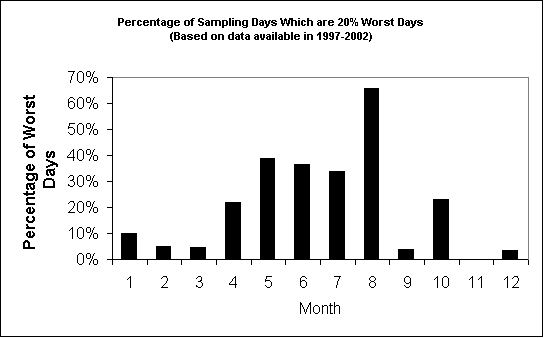
Figure 3 suggests that the highest occurrence of the 20% worst days happened in August, in which more than ~66% of the sampling days are the 20% haziest days at Death Valley Monument. As shown in Figure 4, OMC is the largest aerosol contributor to haze in July and August during which the contribution of OMC to haze is ~ 30% in the worst days. Most of the 20% worst days happened in the Spring and Summer. Sulfate and CM each contributes ~ 20 - 30% in the 20% worst days during this time period.
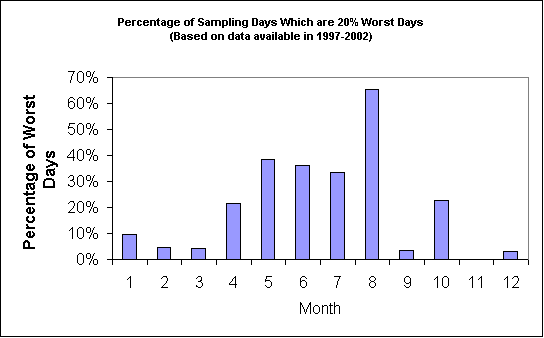
Figure 3 Percentage of sampling days that are 20% worst days in each month (Based on data available 1997-2002) (Data Table) (B&W)
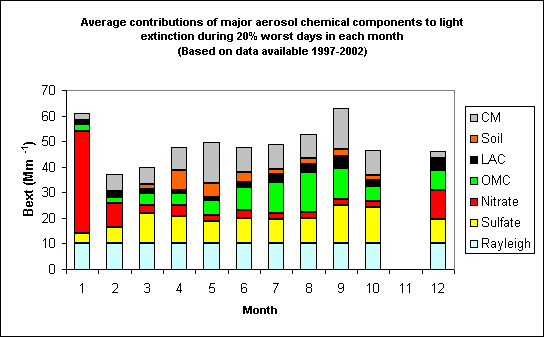
Figure 4 Average contributions of major aerosol chemical components to light extinction during 20% worst days in each month (Based on data available 1997-2002) (Data Table) (B&W)
Back to Previous Page