|
| |
|
Tribal Assessment |
|
The Columbia Plateau Region |
|
| Correlation curves |
|
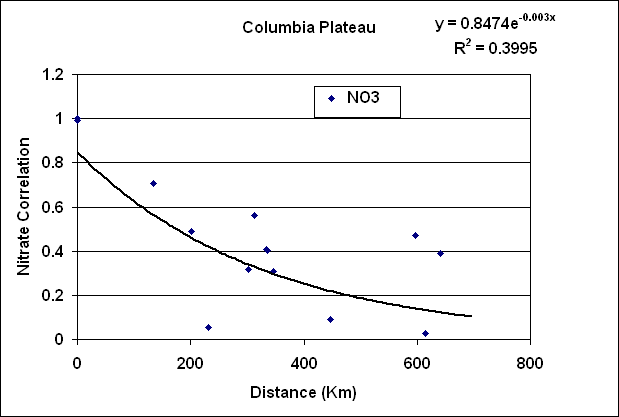
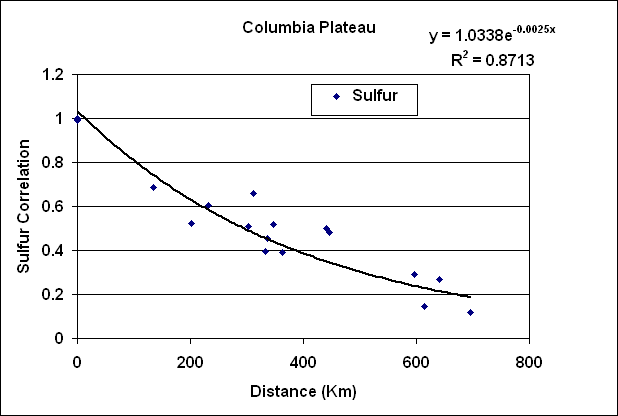
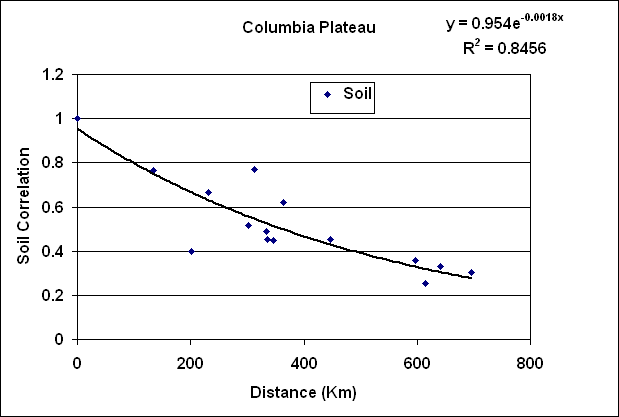
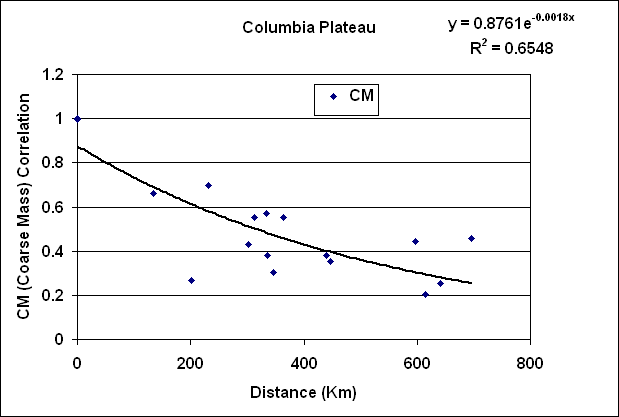
| Here we present the
inter-site correlations for this region by chemical species (S,
NO3,
OC,
EC,
soil and CM).
Each graph shows the correlation between all of the individual sites and
their correlation. The black line shows the curve fit to an
exponential. In the upper right hand corner of the graph, we show the
exponential curve fit of the correlation verses distance as well as the
correlation coefficient. |
|
 |
|
 |
|
 |
|
 |
|
 |
|
 |
|
|
|
|
|