In order to identify the sources of aerosols
in the western United States,
Positive Matrix
Factorization (PMF) receptor model is applied to the 24-hr integrated
aerosol chemical composition data obtained at the Class I areas of the
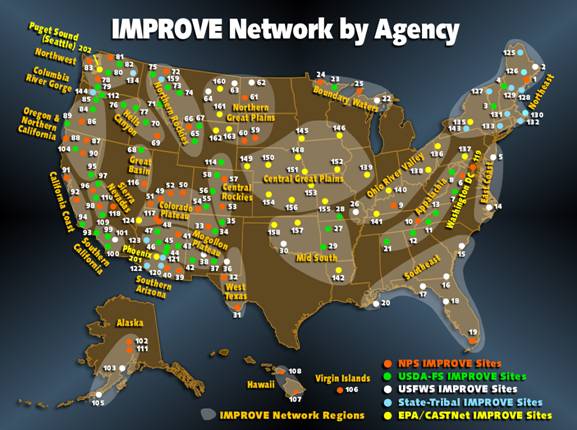
Western Regional Air Partnership (WRAP) region through the Interagency
Monitoring of Protected Visual Environments (IMPROVE) program. The IMPROVE
sites in the WRAP region are grouped into 18 sub-regions (including West
Texas region) as shown in Figure 1.
PMF is applied to
each group to generate profiles of source factors. Normalized source
profiles and the quantitative source contributions for each resolved
factor are calculated. The major sources that contribute to the aerosol
loadings in the western United States are identified. The similarities and
differences of chemical source profiles, and the major aerosol source
contributors in different regions of the western United States are
investigated. Based on the profile and the daily contribution to aerosol
concentration of each source factor, the contributions of source factors
to the aerosol light extinction coefficients are estimated using the
IMPROVE method. The importance of the major aerosol sources to regional
haze and visibility in the Class I areas of the western United States is
discussed.