| |
| 2.5 Conclusion |
| |
| The results from this task
present possible representative IMPROVE sites for nearly 80 percent of the
tribes in the western US. A total of 49 tribes did not have an adequate
IMPROVE site to call as representative in this task. In some cases more than
one IMPROVE site may be a reasonable candidate. The decision of using a
strict threshold ratio of 1 in the analysis seemed to be reseasonable given
the density of IMPROVE sites in the western US. |
|
| For the tribes that had a
representative IMPROVE site, Appendix E provides a list of one or more sites
that could be chosen. All of the tribes listed in that appendix had a ratio
of 1, meaning that the IMPROVE site probably was within the representative
distance of that tribe. For those tribes that are not listed in Appendix E,
there are two choices that would help in finding an appropriate IMPROVE site
if one exists. |
| |
| The first choice is to use
the COHA tribal website for looking at more site options even though they
are not represenatative of the tribe. For example, the Moapa River Tribe has
two sites with a ratio around 0.3 as shown in Figure 4-13. These sites are
outside of the representative distance of 99 km but roughly 30 percent of
the trajectories in and out of those sites go over the tribe. |
| |
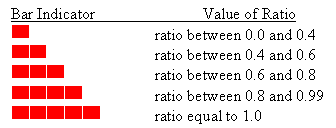
| The website uses a graphical
means to judge the representativeness of one or more sites for a tribe. The
“Rating” shows a red bar that indicates the value of the ratio such that |
| |
|

|
| |
| So for a tribe that has a
representative site, there will be at least one IMPROVE that has 5 red bars
in the graphical indicator. |
| |
| The scond option is to seek
the results from the next section that consider emission sources in the
analysis. These results can be used to evaluate representative IMPROVE sites
as well as those that ranked second or third from this task. |
| |
| |
| |