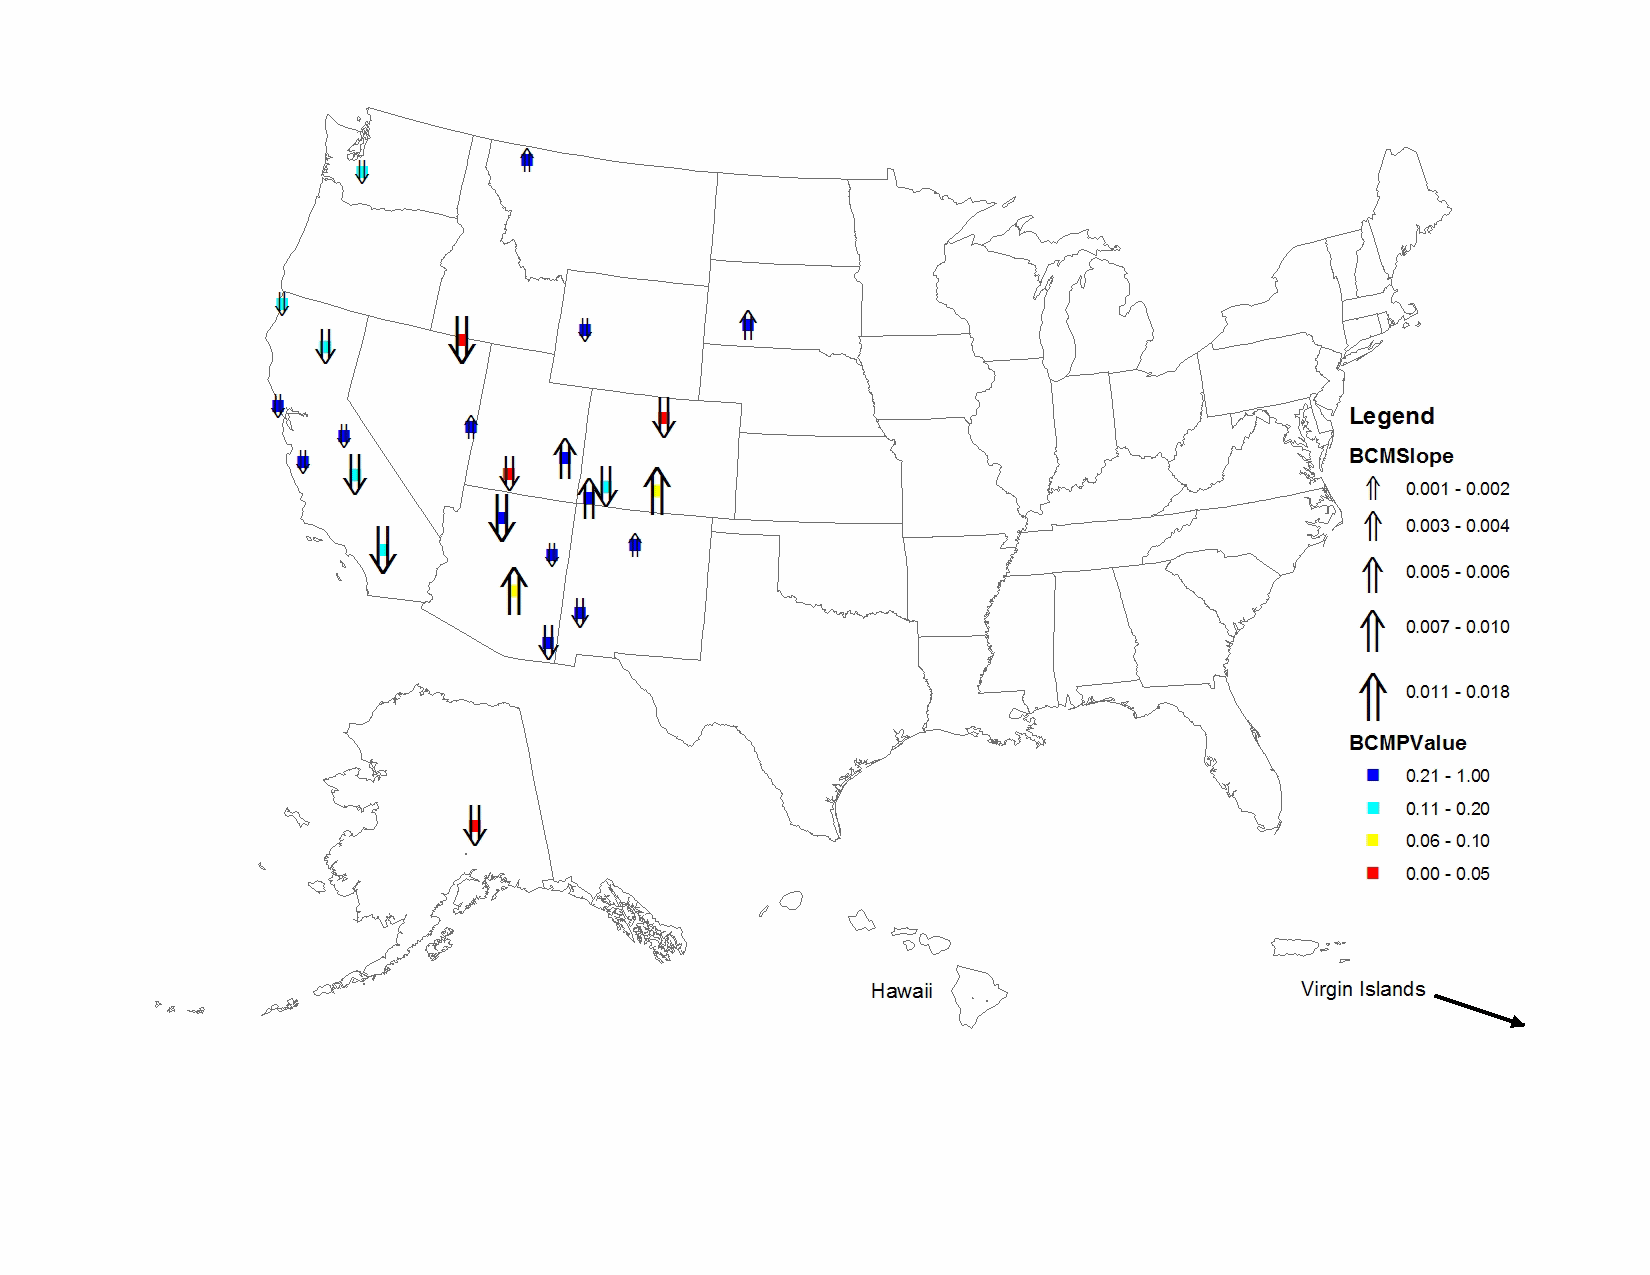
| Year |
|
1994 |
1995 |
1996 |
1997 |
1998 |
1999 |
2000 |
2001 |
2002 |
2003 |
|
Slope
(1/Mm/Year) |
P-Value |
| BADL1 |
Badlands National Park |
0.374 |
0.245 |
0.248 |
0.240 |
0.316 |
0.298 |
0.261 |
0.401 |
0.442 |
0.235 |
|
0.003 |
0.364 |
| BAND1 |
Bandelier National Monument |
0.336 |
0.334 |
0.358 |
0.225 |
0.349 |
0.383 |
0.278 |
0.372 |
0.368 |
0.222 |
|
0.002 |
0.500 |
| BRCA1 |
Bryce Canyon National Park |
0.190 |
0.175 |
0.146 |
0.176 |
0.168 |
0.172 |
0.144 |
0.182 |
0.107 |
0.131 |
|
-0.006 |
0.036 |
| BRID1 |
Bridger Wilderness |
0.110 |
0.113 |
0.087 |
0.123 |
0.083 |
0.125 |
0.093 |
0.123 |
0.084 |
0.094 |
|
-0.001 |
0.431 |
| CANY1 |
Canyonlands National Park |
0.283 |
0.262 |
0.195 |
0.273 |
0.346 |
0.319 |
0.219 |
0.439 |
0.438 |
0.210 |
|
0.007 |
0.300 |
| CHIR1 |
Chiricahua National Monument |
0.391 |
0.399 |
0.465 |
0.356 |
0.216 |
0.671 |
0.365 |
0.254 |
0.526 |
0.348 |
|
-0.005 |
0.364 |
| DENA1 |
Denali National Park |
0.098 |
0.107 |
0.088 |
0.076 |
0.087 |
0.165 |
0.049 |
0.057 |
0.039 |
0.031 |
|
-0.008 |
0.005 |
| GICL1 |
Gila Wilderness |
0.228 |
0.191 |
0.329 |
0.165 |
0.210 |
0.349 |
0.198 |
0.222 |
0.211 |
0.160 |
|
-0.004 |
0.300 |
| GLAC1 |
Glacier National Park |
0.227 |
0.161 |
0.181 |
0.180 |
0.160 |
0.154 |
0.144 |
0.237 |
0.251 |
0.203 |
|
0.001 |
0.500 |
| GRBA1 |
Great Basin National Park |
0.295 |
0.156 |
0.154 |
0.195 |
0.187 |
0.442 |
0.163 |
0.211 |
0.210 |
0.178 |
|
0.002 |
0.431 |
| GRSA1 |
Great Sand Dunes National Monument |
0.216 |
0.360 |
0.373 |
0.430 |
0.462 |
0.491 |
0.299 |
0.442 |
0.361 |
0.446 |
|
0.014 |
0.078 |
| INGA1 |
Indian Gardens |
0.318 |
0.419 |
0.487 |
0.292 |
0.372 |
0.534 |
0.325 |
0.534 |
0.283 |
0.200 |
|
-0.013 |
0.242 |
| JARB1 |
Jarbidge Wilderness |
0.133 |
0.116 |
0.165 |
0.375 |
0.176 |
0.157 |
0.094 |
0.104 |
0.068 |
0.079 |
|
-0.012 |
0.036 |
| LAVO1 |
Lassen Volcanic National Park |
0.140 |
0.194 |
0.068 |
0.113 |
0.069 |
0.110 |
0.101 |
0.148 |
0.094 |
0.052 |
|
-0.006 |
0.108 |
| MEVE1 |
Mesa Verde National Park |
0.383 |
0.337 |
0.322 |
0.363 |
0.371 |
0.348 |
0.233 |
0.351 |
0.598 |
0.498 |
|
0.008 |
0.242 |
| MORA1 |
Mount Rainier National Park |
0.070 |
0.039 |
0.057 |
0.050 |
0.049 |
0.060 |
0.065 |
0.055 |
0.034 |
0.036 |
|
-0.002 |
0.146 |
| PEFO1 |
Petrified Forest National Park |
0.408 |
0.453 |
0.361 |
0.511 |
0.409 |
0.529 |
0.301 |
0.404 |
0.535 |
0.318 |
|
-0.001 |
0.500 |
| PINN1 |
Pinnacles National Monument |
0.175 |
0.140 |
0.078 |
0.259 |
0.126 |
0.172 |
0.138 |
0.121 |
0.186 |
0.136 |
|
-0.001 |
0.364 |
| PORE1 |
Point Reyes National Seashore |
0.098 |
0.084 |
0.075 |
0.074 |
0.111 |
0.093 |
0.090 |
0.070 |
0.106 |
0.074 |
|
-0.001 |
0.300 |
| REDW1 |
Redwood National Park |
0.049 |
0.046 |
0.061 |
0.062 |
0.065 |
0.072 |
0.053 |
0.044 |
0.044 |
0.035 |
|
-0.002 |
0.146 |
| ROMO1 |
Rocky Mountain National Park |
0.344 |
0.217 |
0.156 |
0.148 |
0.136 |
0.164 |
0.125 |
0.186 |
0.107 |
0.115 |
|
-0.010 |
0.008 |
| SAGO1 |
San Gorgonio Wilderness |
0.214 |
0.257 |
0.641 |
0.371 |
0.360 |
0.651 |
0.303 |
0.146 |
0.217 |
0.212 |
|
-0.011 |
0.190 |
| SEQU1 |
Sequoia National Park |
0.251 |
0.174 |
0.218 |
0.324 |
0.131 |
0.315 |
0.208 |
0.123 |
0.206 |
0.134 |
|
-0.007 |
0.108 |
| TONT1 |
Tonto National Monument |
0.358 |
0.421 |
0.460 |
0.500 |
0.492 |
0.445 |
0.272 |
0.459 |
0.545 |
0.598 |
|
0.018 |
0.054 |
| WEMI1 |
Weminuche Wilderness |
0.233 |
0.251 |
0.252 |
0.276 |
0.279 |
0.270 |
0.200 |
0.234 |
0.171 |
0.186 |
|
-0.008 |
0.146 |
| YOSE1 |
Yosemite National Park |
0.101 |
0.108 |
0.122 |
0.094 |
0.109 |
0.158 |
0.109 |
0.137 |
0.088 |
0.070 |
|
-0.002 |
0.364 |