|
Representativeness of 2002 Transport |
|
| This analysis will
investigate the representativeness of transport during the worst case days for 2002
compared to the
2000 to 2004 base period. This will include the calculation of the 20th percentile worst case
5-year and 2002 residence time and maps being produced for each IMPROVE monitoring site.
A map of differences between 2002 and the 5-year average and the ratio of
2002 to the 5 year average will be produced for each location. We will also
compare the aerosol composition for the worst case days for 2002 vs
2000-2004 by site. |
| |
To see the results of the
residence time analysis go to the main
product query page and select a site. To see the maps choose the
 icon after making the query. icon after making the query. |
| |
| Differences in residence time
during the worst 20 percent extinction days in 2002 compared to the 5-year
period from 2000 to 2004. Differences in annual residence time during the
haziest days (worst 20% extinction) may be due to drought, El Nino, La Nina,
year to year variations in wildfires, high wind dust events as well as
stagnation events as represented by high sulfate, organics and nitrate. |
|
| The year 2002 (late 2002 to
early 2003) was a moderate El Nino year (average SOI.= -0.83). During the
summer of 2002, temperatures were higher than normal in the western US with
summer temperatures 1 to 1.5 degrees C higher than the 1968 to 1996 average
(Figure 1). |
|
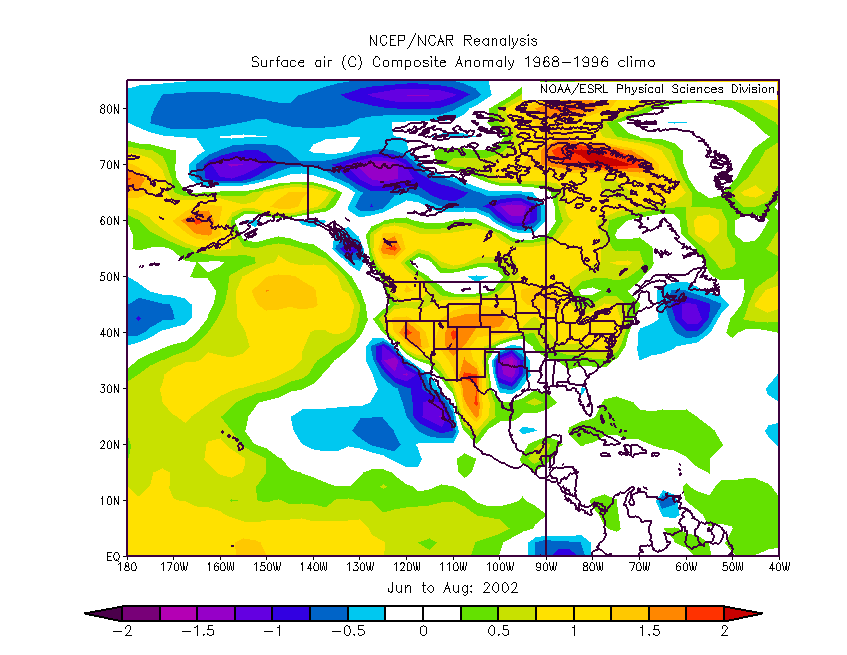 |
| Figure 1.
Surface temperature anomaly during the summer of 2002 compared to the 1968 to 1996 climatology
from the NCEP Reanalysis Database. Click on image to get full size map. |
|
| Looking at the large scale
weather patterns during the summer of 2002, the area off the coast of the NW
had a significant 500 mb geopotential height anomaly between 20 to 40 meters
indicating stronger than normal upper level ridging. |
|
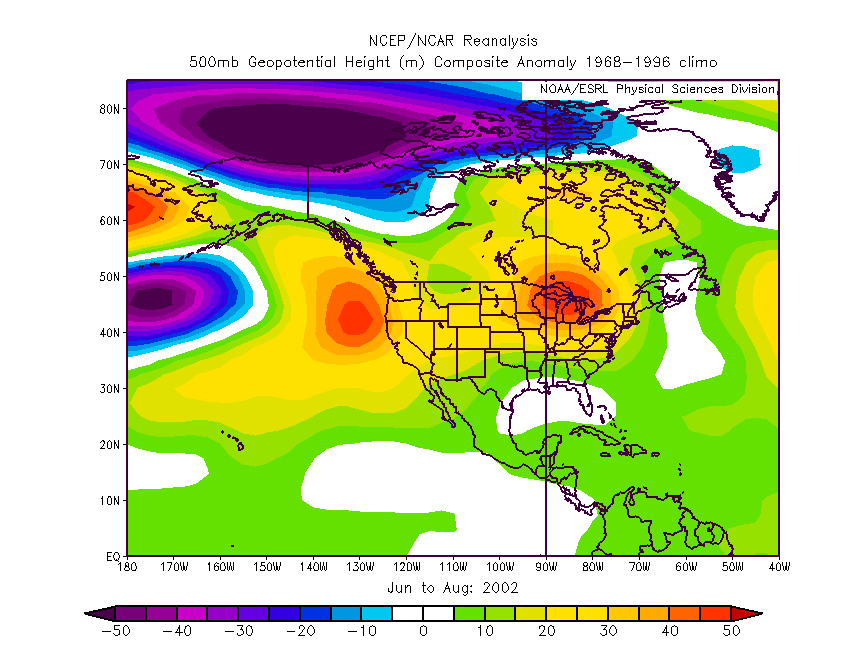 |
| Figure 2.
500 mb geopotential height anomaly of 2002 compared to the 1968 to 1996 climatology
from the NCEP Reanalysis Database. Click on image to get full size map. |
|
|
| Drought conditions yielded
above normal western US wildfires in 2002. According to the NCDC, the 2002
wildfire season began early and was the second largest in the past 50 years,
after the year 2000. During the 2000 to 2004 period the western US has
experienced drought with below normal
precipitation starting early in 2000. |
| Some notable large fires in
the western US during 2002 include: |
| Fire name |
State |
Area burned (acres) |
Dates of fire |
| Biscuit |
Oregon |
499,965 |
7/13/02 - 9/5/02 |
| Rodeo/Chediski |
Arizona |
468,638 |
6/18/02 - 7/7/02 |
| McNally |
California |
150,696 |
8/17/02 - 8/30/02 |
| Tool Box Complex |
Oregon |
120,085 |
7/12/02 - 8/5/02 |
| Hayman |
Colorado |
136,000 |
6/8/02- 7/2/02 |
| Ponil |
New Mexico |
92,500 |
6/2/02 - 6/17/02 |
|
| According to the NIFC, three
states recorded their largest wildfires this century (Arizona, Colorado and
Oregon). |
|
|
|
|

