|
Grand Canyon National Park (INGA1)
Trends Analysis |
|
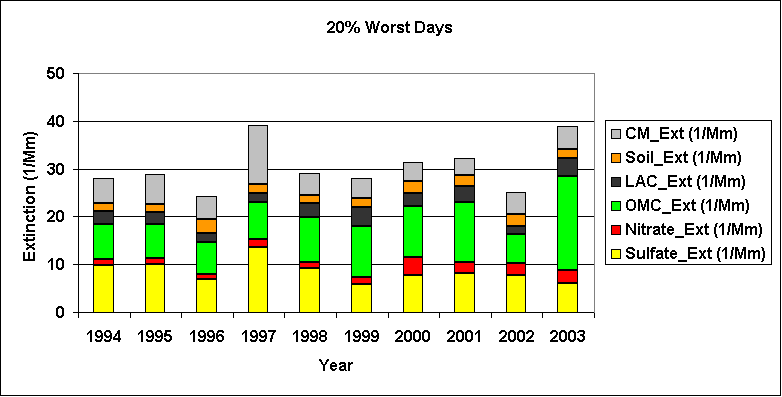
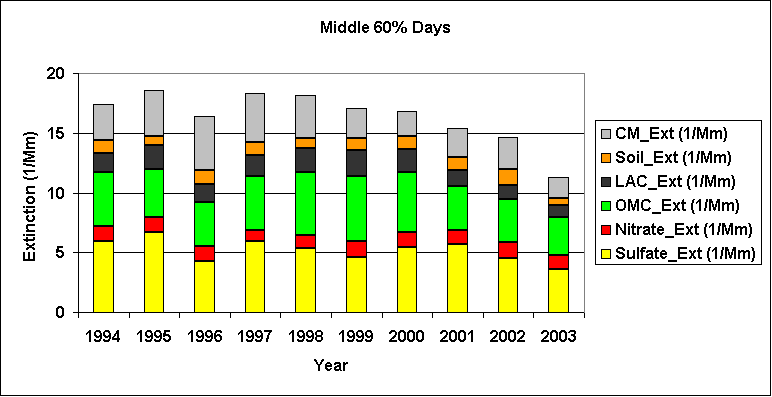
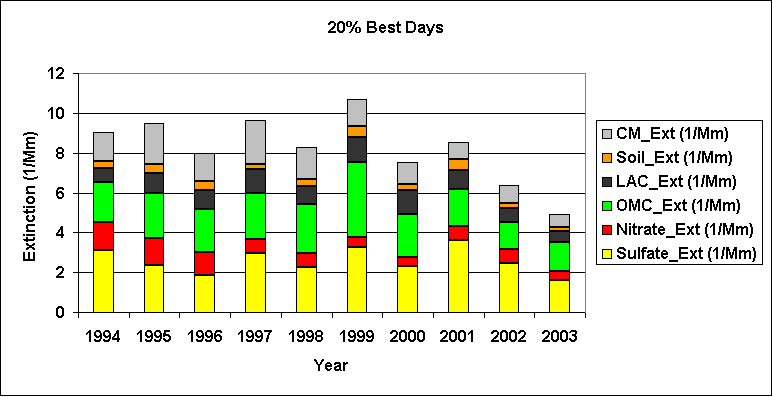
| The tables and figures below
show the trends analysis
results for 20% worst, middle 60% and 20% best days at INGA1 based on
light extinction coefficient
data from 1994 to 2003. Overall, there is no significant trend in
aerosol light extinction in 20% worst days. Nitrate and OMC extinctions
increased significantly, while CM extinctions decreased significantly in the
worst days. Aerosol light extinction coefficients decreased significantly in
both middle 60% days and 20% best days. In the middle 60% days the
decrease trend is due to decrease in sulfate and CM light extinction
coefficients, and in the 20% best days it is due to nitrate and CM. |
|
|
| Table 1. Number of valid
measurements used in the trends analysis |
|
| Site |
Year |
StartDate |
EndDate |
NoMeas |
| INGA1 |
1994 |
1/1/1994 |
12/31/1994 |
84 |
| INGA1 |
1995 |
1/4/1995 |
12/30/1995 |
68 |
| INGA1 |
1996 |
1/10/1996 |
12/28/1996 |
56 |
| INGA1 |
1997 |
1/1/1997 |
12/27/1997 |
53 |
| INGA1 |
1998 |
1/14/1998 |
11/28/1998 |
77 |
| INGA1 |
1999 |
1/27/1999 |
12/22/1999 |
61 |
| INGA1 |
2000 |
1/8/2000 |
12/29/2000 |
56 |
| INGA1 |
2001 |
1/1/2001 |
12/6/2001 |
73 |
| INGA1 |
2002 |
1/17/2002 |
12/31/2002 |
71 |
| INGA1 |
2003 |
1/3/2003 |
12/29/2003 |
84 |
|
|
| Table 2. Trends analysis for
20% worst visibility days |
|
| Site |
Year |
Bep (1/Mm) |
Sulfate_Ext (1/Mm) |
Nitrate_Ext (1/Mm) |
OMC_Ext (1/Mm) |
LAC_Ext (1/Mm) |
Soil_Ext (1/Mm) |
CM_Ext (1/Mm) |
| INGA1 |
1994 |
28.13 |
9.90 |
1.12 |
7.46 |
2.72 |
1.67 |
5.26 |
| INGA1 |
1995 |
28.89 |
10.03 |
1.18 |
7.26 |
2.44 |
1.69 |
6.29 |
| INGA1 |
1996 |
24.35 |
6.90 |
1.14 |
6.57 |
1.93 |
2.87 |
4.95 |
| INGA1 |
1997 |
39.02 |
13.50 |
1.74 |
7.70 |
2.02 |
1.77 |
12.29 |
| INGA1 |
1998 |
29.09 |
9.14 |
1.23 |
9.53 |
2.86 |
1.64 |
4.69 |
| INGA1 |
1999 |
27.98 |
5.83 |
1.40 |
10.85 |
3.85 |
1.82 |
4.23 |
| INGA1 |
2000 |
31.41 |
7.70 |
3.74 |
10.74 |
2.68 |
2.54 |
4.00 |
| INGA1 |
2001 |
32.26 |
8.12 |
2.40 |
12.44 |
3.46 |
2.27 |
3.58 |
| INGA1 |
2002 |
25.18 |
7.76 |
2.46 |
6.04 |
1.77 |
2.51 |
4.63 |
| INGA1 |
2003 |
38.84 |
6.12 |
2.58 |
19.83 |
3.76 |
1.71 |
4.84 |
|
|
|
|
|
|
|
|
|
| Slope (1/Mm/Year) |
|
0.561 |
-0.345 |
0.170 |
0.862 |
0.116 |
0.031 |
-0.210 |
| S-Value |
|
11 |
-17 |
33 |
21 |
9 |
11 |
-21 |
| P-Value |
|
0.190 |
0.078 |
0.001 |
0.036 |
0.242 |
0.190 |
0.036 |
|
 |
|
| Table 3. Trends analysis for
middle 60% visibility days |
|
| Site |
Year |
Bep (1/Mm) |
Sulfate_Ext (1/Mm) |
Nitrate_Ext (1/Mm) |
OMC_Ext (1/Mm) |
LAC_Ext (1/Mm) |
Soil_Ext (1/Mm) |
CM_Ext (1/Mm) |
| INGA1 |
1994 |
17.41 |
5.98 |
1.20 |
4.50 |
1.60 |
1.10 |
3.04 |
| INGA1 |
1995 |
18.57 |
6.69 |
1.22 |
4.09 |
1.97 |
0.76 |
3.84 |
| INGA1 |
1996 |
16.43 |
4.23 |
1.32 |
3.63 |
1.51 |
1.18 |
4.55 |
| INGA1 |
1997 |
18.30 |
5.90 |
0.97 |
4.50 |
1.79 |
1.03 |
4.11 |
| INGA1 |
1998 |
18.15 |
5.36 |
1.10 |
5.23 |
2.06 |
0.85 |
3.56 |
| INGA1 |
1999 |
17.05 |
4.62 |
1.28 |
5.49 |
2.16 |
0.96 |
2.53 |
| INGA1 |
2000 |
16.85 |
5.43 |
1.25 |
5.07 |
1.85 |
1.10 |
2.15 |
| INGA1 |
2001 |
15.36 |
5.67 |
1.18 |
3.67 |
1.38 |
1.08 |
2.38 |
| INGA1 |
2002 |
14.62 |
4.50 |
1.40 |
3.60 |
1.17 |
1.28 |
2.66 |
| INGA1 |
2003 |
11.32 |
3.63 |
1.17 |
3.13 |
1.01 |
0.58 |
1.80 |
|
|
|
|
|
|
|
|
|
| Slope (1/Mm/Year) |
|
-0.565 |
-0.216 |
0.009 |
-0.077 |
-0.072 |
-0.001 |
-0.255 |
| S-Value |
|
-31 |
-21 |
3 |
-13 |
-15 |
-1 |
-25 |
| P-Value |
|
0.002 |
0.036 |
0.431 |
0.146 |
0.108 |
0.500 |
0.014 |
|
 |
|
| Table 4. Trends analysis for
20% best visibility days |
|
| Site |
Year |
Bep (1/Mm) |
Sulfate_Ext (1/Mm) |
Nitrate_Ext (1/Mm) |
OMC_Ext (1/Mm) |
LAC_Ext (1/Mm) |
Soil_Ext (1/Mm) |
CM_Ext (1/Mm) |
| INGA1 |
1994 |
9.05 |
3.09 |
1.44 |
1.99 |
0.73 |
0.32 |
1.48 |
| INGA1 |
1995 |
9.51 |
2.38 |
1.32 |
2.27 |
1.03 |
0.42 |
2.09 |
| INGA1 |
1996 |
7.99 |
1.84 |
1.17 |
2.14 |
0.96 |
0.49 |
1.40 |
| INGA1 |
1997 |
9.64 |
2.97 |
0.71 |
2.28 |
1.20 |
0.29 |
2.18 |
| INGA1 |
1998 |
8.30 |
2.26 |
0.68 |
2.50 |
0.88 |
0.37 |
1.61 |
| INGA1 |
1999 |
10.67 |
3.25 |
0.53 |
3.75 |
1.27 |
0.53 |
1.34 |
| INGA1 |
2000 |
7.51 |
2.31 |
0.44 |
2.19 |
1.18 |
0.33 |
1.08 |
| INGA1 |
2001 |
8.51 |
3.61 |
0.69 |
1.88 |
0.97 |
0.53 |
0.83 |
| INGA1 |
2002 |
6.36 |
2.47 |
0.69 |
1.37 |
0.68 |
0.28 |
0.86 |
| INGA1 |
2003 |
4.94 |
1.62 |
0.45 |
1.46 |
0.55 |
0.20 |
0.66 |
|
|
|
|
|
|
|
|
|
| Slope (1/Mm/Year) |
|
-0.399 |
-0.031 |
-0.106 |
-0.065 |
-0.038 |
-0.013 |
-0.161 |
| S-Value |
|
-19 |
-3 |
-29 |
-11 |
-9 |
-9 |
-31 |
| P-Value |
|
0.054 |
0.431 |
0.005 |
0.190 |
0.242 |
0.242 |
0.002 |
|
|
 |
|

