Conceptual
Model
|
Site
Setting
|
Aerosol
& Trends Analysis
|
Backtrajectory
Analysis
|
PMF
Analysis
|
PMF Weighted
Backtrajectory Analysis
|
Chassahowitzka NWR
Trends Analysis |
|
|
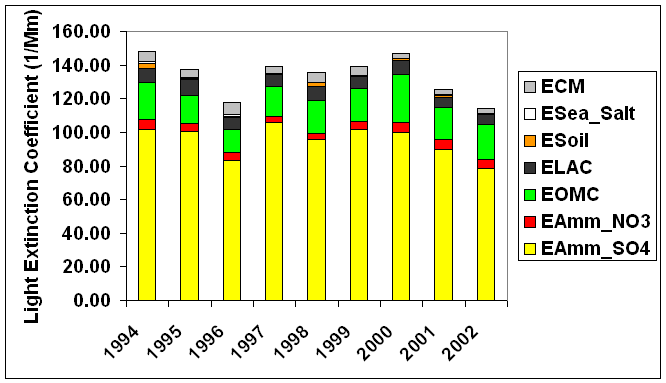
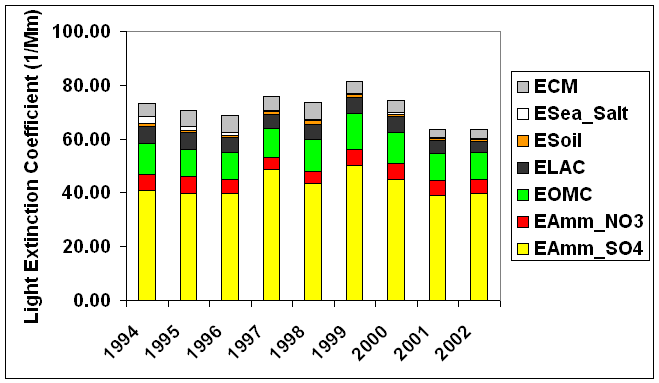
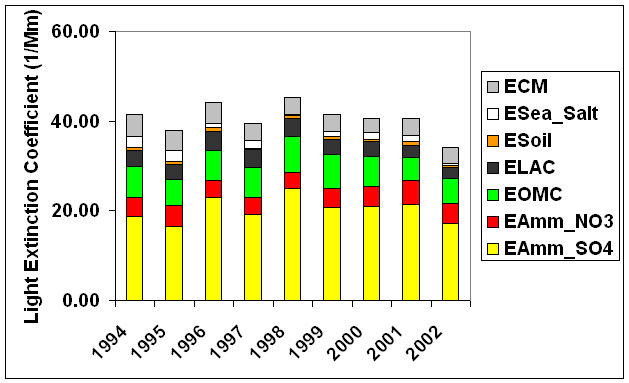
The tables and figures below
show the trends analysis
results for 20% worst, middle 60% and 20% best days at CHAS1 based on
light extinction coefficient
data from 1994 to 2002 (no complete aerosol data is available in 2003 and
2004). Overall, there is no significant trend in aerosol
light extinction coefficients in 20% worst days. But there are statistically significant
decrease trends in elemental carbon (LAC) and coarse mass (CM) light extinction
coefficients in 20% worst days. Significant decrease trends of LAC and CM
light extinction coefficients are also found in 20% best and middle 60%
visibility days. |
|
|
|
| Table 1. Trends analysis of
light extinction coefficients (1/Mm) for
20% worst visibility days |
|
| site |
year |
Total Bext |
Aerosol Ext |
EAmm_SO4 |
EAmm_NO3 |
EOMC |
ELAC |
ESoil |
ESea_Salt |
ECM |
| CHAS1 |
1994 |
158.83 |
147.83 |
101.86 |
6.09 |
21.44 |
8.85 |
2.70 |
1.35 |
5.54 |
| CHAS1 |
1995 |
148.15 |
137.15 |
100.44 |
4.96 |
16.76 |
9.06 |
0.92 |
0.35 |
4.65 |
| CHAS1 |
1996 |
128.88 |
117.88 |
83.30 |
4.81 |
13.82 |
7.13 |
0.64 |
0.90 |
7.27 |
| CHAS1 |
1997 |
150.25 |
139.25 |
105.73 |
3.42 |
17.87 |
7.13 |
0.65 |
0.07 |
4.38 |
| CHAS1 |
1998 |
146.41 |
135.41 |
95.58 |
3.78 |
19.85 |
8.08 |
2.20 |
0.00 |
5.93 |
| CHAS1 |
1999 |
149.93 |
138.93 |
101.74 |
4.82 |
19.36 |
7.13 |
0.61 |
0.11 |
5.15 |
| CHAS1 |
2000 |
157.92 |
146.92 |
99.71 |
6.39 |
28.21 |
8.69 |
0.71 |
0.20 |
3.00 |
| CHAS1 |
2001 |
136.60 |
125.60 |
89.99 |
5.65 |
19.29 |
5.83 |
1.39 |
0.34 |
3.10 |
| CHAS1 |
2002 |
125.05 |
114.05 |
78.59 |
5.33 |
20.60 |
6.19 |
0.66 |
0.00 |
2.69 |
|
|
|
|
|
|
|
|
|
|
|
| Slope |
|
-2.39 |
-2.39 |
-1.72 |
0.05 |
0.55 |
-0.32 |
-0.03 |
-0.08 |
-0.37 |
| S-Value |
|
-12 |
-12 |
-16 |
4 |
10 |
-20 |
-6 |
-15 |
-20 |
| P-Value |
|
0.130 |
0.130 |
0.060 |
0.381 |
0.179 |
0.022 |
0.306 |
0.090 |
0.022 |
|
 |
|
| Table 2. Trends analysis for
middle 60% visibility days |
|
| site |
year |
Total Bext |
Aerosol Ext |
EAmm_SO4 |
EAmm_NO3 |
EOMC |
ELAC |
ESoil |
ESea_Salt |
ECM |
| CHAS1 |
1994 |
84.13 |
73.13 |
40.93 |
6.00 |
11.46 |
6.35 |
1.04 |
2.52 |
4.83 |
| CHAS1 |
1995 |
81.64 |
70.64 |
39.86 |
6.39 |
9.92 |
6.14 |
0.89 |
1.51 |
5.92 |
| CHAS1 |
1996 |
79.79 |
68.79 |
39.64 |
5.22 |
10.09 |
5.68 |
0.69 |
1.31 |
6.16 |
| CHAS1 |
1997 |
86.83 |
75.83 |
48.72 |
4.40 |
10.88 |
5.26 |
1.02 |
0.31 |
5.25 |
| CHAS1 |
1998 |
84.68 |
73.68 |
43.44 |
4.45 |
12.14 |
5.41 |
1.35 |
0.67 |
6.22 |
| CHAS1 |
1999 |
92.35 |
81.35 |
50.25 |
5.88 |
13.22 |
6.19 |
0.86 |
0.61 |
4.33 |
| CHAS1 |
2000 |
85.27 |
74.27 |
44.93 |
6.13 |
11.56 |
5.72 |
0.86 |
0.77 |
4.31 |
| CHAS1 |
2001 |
74.67 |
63.67 |
38.94 |
5.71 |
10.01 |
4.79 |
0.91 |
0.09 |
3.21 |
| CHAS1 |
2002 |
74.50 |
63.50 |
39.70 |
5.13 |
10.02 |
4.22 |
0.63 |
0.44 |
3.36 |
|
|
|
|
|
|
|
|
|
|
|
| Slope |
|
-0.95 |
-0.95 |
-0.08 |
-0.05 |
0.01 |
-0.22 |
-0.02 |
-0.21 |
-0.35 |
| S-Value |
|
-6 |
-6 |
-2 |
-6 |
2 |
-20 |
-12 |
-22 |
-18 |
| P-Value |
|
0.306 |
0.306 |
0.460 |
0.306 |
0.460 |
0.022 |
0.130 |
0.012 |
0.038 |
|
|
 |
|
| Table 3. Trends analysis for
20% best visibility days |
|
| site |
year |
Total Bext |
Aerosol Ext |
EAmm_SO4 |
EAmm_NO3 |
EOMC |
ELAC |
ESoil |
ESea_Salt |
ECM |
| CHAS1 |
1994 |
52.39 |
41.39 |
18.77 |
4.20 |
6.89 |
3.57 |
0.76 |
2.36 |
4.84 |
| CHAS1 |
1995 |
48.96 |
37.96 |
16.47 |
4.70 |
5.78 |
3.49 |
0.46 |
2.45 |
4.61 |
| CHAS1 |
1996 |
55.15 |
44.15 |
22.92 |
3.93 |
6.72 |
4.15 |
0.88 |
0.95 |
4.60 |
| CHAS1 |
1997 |
50.48 |
39.48 |
19.23 |
3.69 |
6.79 |
3.97 |
0.32 |
1.63 |
3.85 |
| CHAS1 |
1998 |
56.19 |
45.19 |
24.93 |
3.52 |
8.11 |
4.05 |
0.74 |
0.22 |
3.62 |
| CHAS1 |
1999 |
52.42 |
41.42 |
20.78 |
4.30 |
7.46 |
3.48 |
0.50 |
1.26 |
3.65 |
| CHAS1 |
2000 |
51.56 |
40.56 |
20.94 |
4.52 |
6.60 |
3.47 |
0.36 |
1.56 |
3.11 |
| CHAS1 |
2001 |
51.51 |
40.51 |
21.51 |
5.22 |
5.16 |
2.59 |
0.95 |
1.49 |
3.60 |
| CHAS1 |
2002 |
45.17 |
34.17 |
17.16 |
4.43 |
5.70 |
2.37 |
0.34 |
0.57 |
3.58 |
|
|
|
|
|
|
|
|
|
|
|
| Slope |
|
-0.50 |
-0.50 |
0.26 |
0.07 |
-0.07 |
-0.16 |
-0.02 |
-0.17 |
-0.19 |
| S-Value |
|
-8 |
-8 |
6 |
8 |
-10 |
-22 |
-6 |
-14 |
-30 |
| P-Value |
|
0.238 |
0.238 |
0.306 |
0.238 |
0.179 |
0.012 |
0.306 |
0.090 |
0.000 |
|
|
 |
|